- Industry Insights
- Resources
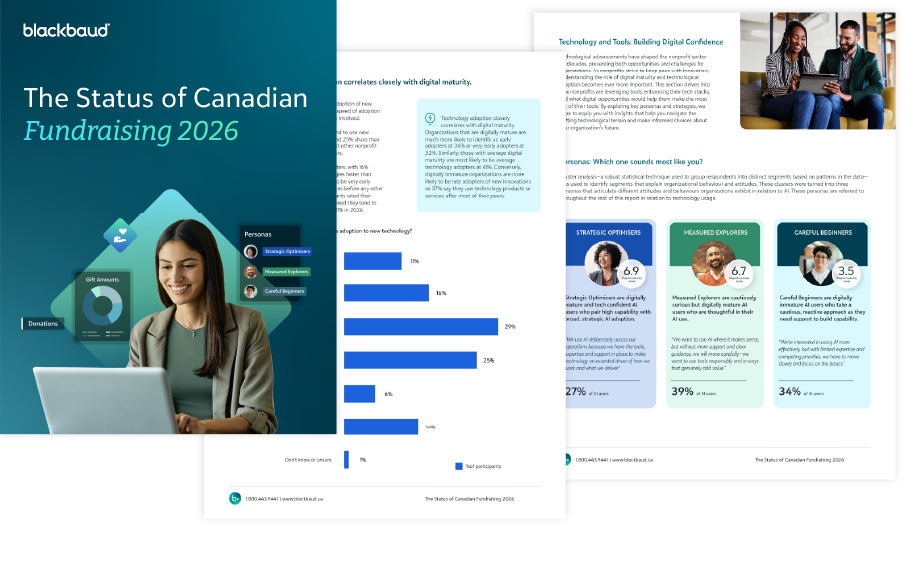
- The Status of Canadian Fundraising 2026 – Chapter Preview
The Status of Canadian Fundraising
Read an excerpt from our 5th edition report
Excerpt Content
Introduction
Now in its fifth year, the annual Status of Canadian Fundraising Report explores the evolving dynamics of nonprofit fundraising. These year-over-year insights show emerging trends, persistent challenges, and new opportunities, helping organizations to understand and benchmark their performance and make more informed strategic decisions.
This year’s research reflects the perspectives of hundreds of professionals in Canada from diverse backgrounds, organizations, and career paths who participated in the research and shared their unique insights into the factors shaping Canadian social impact community in 2026.
Each year, the research focuses on key trends or changes impacting the sector—alongside evaluating sector performance, opportunities for growth, and, more recently, organizations’ digital transformation. In 2026, we continue the AI deep dive to understand attitudes towards AI, levels of adoption, concerns and challenges, and the cultures organizations are building around AI use.
The Status of Canadian Fundraising report is part of Blackbaud’s global Status of Fundraising research series, surveying audiences in Canada, the United Kingdom, and Australia and New Zealand. Before diving into the results, we also want to say a massive thank you to our data analyst and market researcher, Susie Mullen, whose help has been invaluable.
Sector Performance: Finding Purpose and Driving Impact
The first half of the research focused on nonprofit organizations’ recent performance in order to benchmark how the Canadian nonprofit sector’s performance is trending year-over-year. Importantly, we also wanted to find out what are the biggest motivators for those working in the sector.
Nonprofit professionals want to be part of a positive impact.
Participants were asked to share, in their own words, what they enjoy most about working in the nonprofit sector to identify their core values, motivations, and sources of fulfilment that drive professionals, even as the sector changes.
Making a difference or positive impact is the biggest motivator for those working in the sector, and 58% of all respondents talk about the positive impact of their work. Community and relationship building are also key motivators, and many discuss the sense of purpose and fulfilment they get from their work.
Most nonprofits meet or exceed their fundraising targets.
The picture for fundraising targets in 2026 looks encouragingly positive, especially in comparison to the year before. At 73%, vast majority of Canadian nonprofits report they achieved their targets, with 45% exceeding and 28% just meeting them. Only one-fifth of organizations failed to reach their goals, and the last 7% didn’t set goals at all—these nonprofits are more likely to be small organizations with revenue of under $1M.
While the data does not delve into how targets are set or their level of ambition, it offers a valuable directional trend when viewed in combination with findings on positive income performance.
“I enjoy working in the nonprofit sector because every project feels connected to a larger purpose, and the impact—whether big or small—creates real, positive change for communities. It’s incredibly motivating to collaborate with people who are driven by mission rather than profit.”
Which best describes your organization’s fundraising performance over the last full financial year?
2025
2026
Recent income performance shows fewer declines and more stability.
In line with the findings on fundraising targets, when we look at voluntary income performance over the last full financial year, the sector shows signs of resilience and stability. This year, just over one quarter say their income decreased in comparison to 34% last year. In turn, more charities are experiencing growth at 44% or stability, with 30% reporting unchanged income—up from 25% in 2025.
While the number of those who have experienced growth has remained relatively stable over the last few years—with 42% in 2024, 41% in 2025, and 44% in 2026—these findings indicate positive and stable sector income performance as 74% of participants have either experienced growth or had a stable income performance.
Thinking about the last full financial year, how did your organization’s voluntary income change, compared with the year before?
2024
2025
2026
Exceptional gifts are, by far, the main drivers of growth.
When drilling deeper into those 44% of organizations whose income increased in the last full financial year, we can identify drivers behind their income growth. Two thirds of those organizations whose income increased say the main driver of growth is major gifts.
Exceptional gifts as drivers of growth are followed by focus on supporter experience and new or different activity, both at 38%, and 34% say their growth was driven by overall donor numbers increasing.
Supporter experience is a much bigger driver of growth this year—only 22% attributed their growth to this in 2025. In turn, in 2025, higher giving values were an important driver of growth, dropping from 34% in 2025 to 26% this year. These findings suggest that these successful organizations are not necessarily focusing on encouraging more people to give, or existing donors to give more, but improving their supporter experience to deepen supporter relationships and drive deeper ongoing engagement and investing in new activities or innovations that open up new avenues for growth.
What do you think were the main drivers of your organization’s income growth?
2025
2026
The current economic situation attributes to income declines.
In turn, we asked those whose income declined over the last year to share the main reasons behind their decline. At 67%, the majority of respondents point to the current economic environment as the biggest factor—for the fourth year in a row. This is followed by overall donor numbers selected by 44% of those whose income was declining and existing supporters giving less mentioned by 31%. One in four also say their income in the year before was boosted by exceptional activity, or that they are not adequately resourced to grow income.
This year, nonprofits whose income decreased are less likely to cite inadequate resourcing as a driver of their income decline, dropping from 37% in 2025 to 25% in 2026.
Organisation size is, by far, the most important variable driving growth, accounting for 72% of the variance in income growth.
Digital maturity accounts for 23% of the variance—but even moderate digital maturity is beneficial, indicating that digital maturity is an enabler of growth.
Major donor capability also accounts for a small 4% of the variance, contributing a small but meaningful uplift to income.